반응형
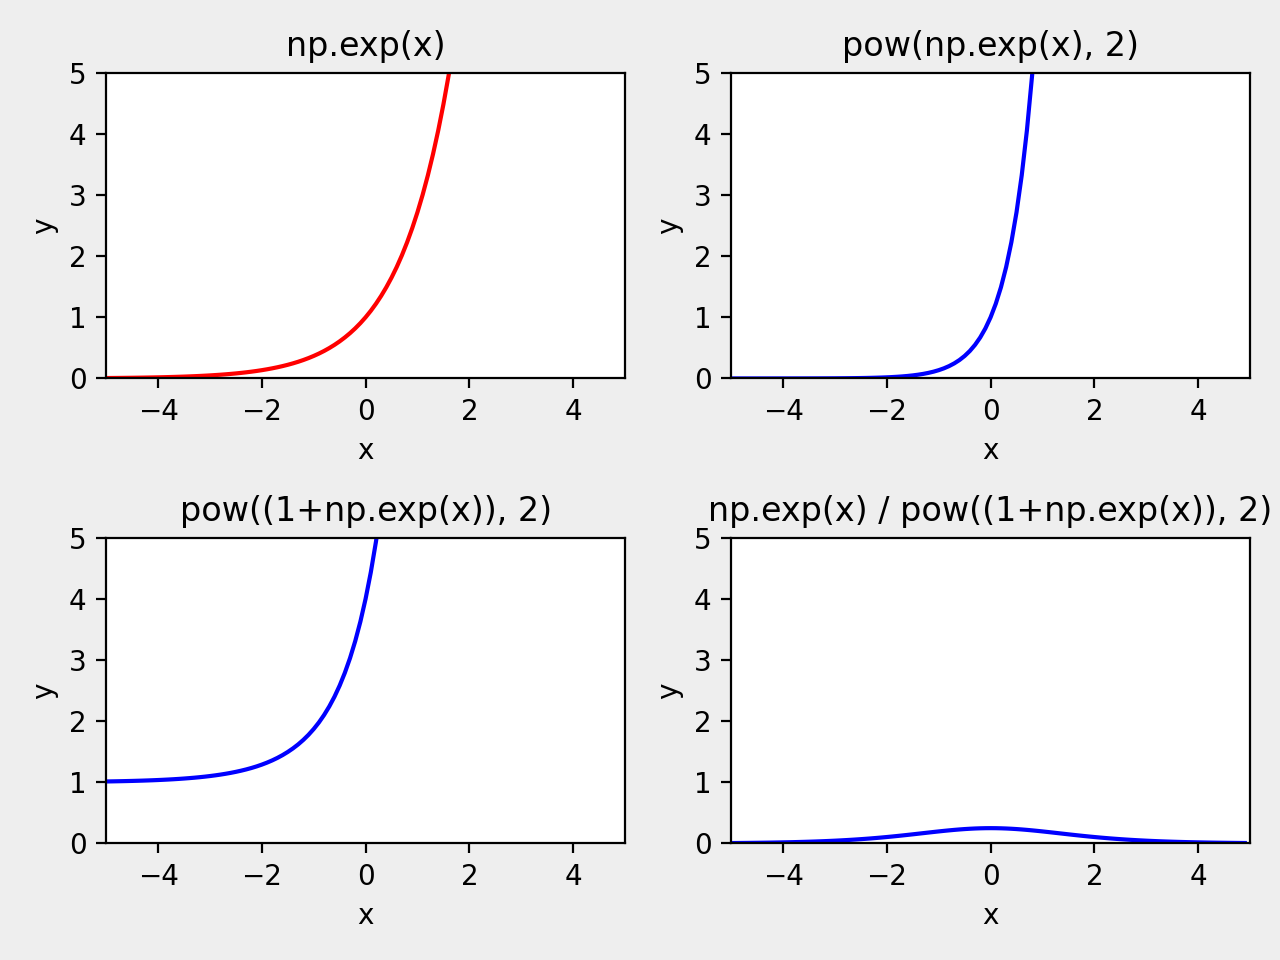
다음 코드는 matplotlib를 사용한 그래프 출력 샘플이다.
import numpy as np
import matplotlib.pyplot as plt
'''
x = np.arange(0,5)
y = x ** 2
'''

#x= np.array([1,2,3,4,5])
x = np.arange( -5, 5, 0.1)

y1 = np.exp(x)
y2 = pow(np.exp(x), 2)
y3 = pow((1+np.exp(x)), 2)
y4 = np.exp(x) / pow((1+np.exp(x)), 2)


plt.subplot(2, 2, 1)                # nrows=2, ncols=1, index=1
#포맷 문자열 ‘ro’는 빨간색 (‘red’)의 원형 (‘o’) 마커를 의미합니다.
# '--'은 점선을 의미. (ex. ro, o-, .-, bs, g^, r--,)
plt.plot(x,y1, 'r-')#plt.plot(x1, y1, 'r--', x2, y2, 'bs', x3, y3, 'g^')
plt.title('np.exp(x)')
plt.axis([-5, 5, 0, 5])# xmin, xmax, ymin, ymax
plt.xlabel('x')
plt.ylabel('y')

plt.subplot(2, 2, 2)                # nrows=2, ncols=1, index=2
#포맷 문자열 ‘b-‘는 파란색 (‘blue’)의 실선 (‘-‘)을 의미합니다.
plt.plot(x,y2, 'b-')
plt.title('pow(np.exp(x), 2)')
plt.axis([-5, 5, 0, 5])# xmin, xmax, ymin, ymax
plt.xlabel('x')
plt.ylabel('y')

plt.subplot(2, 2, 3)                # nrows=2, ncols=1, index=2
#포맷 문자열 ‘b-‘는 파란색 (‘blue’)의 실선 (‘-‘)을 의미합니다.
plt.plot(x,y3, 'b-')
plt.title('pow((1+np.exp(x)), 2)')
plt.axis([-5, 5, 0, 5])# xmin, xmax, ymin, ymax
plt.xlabel('x')
plt.ylabel('y')

plt.subplot(2, 2, 4)                # nrows=2, ncols=1, index=2
#포맷 문자열 ‘b-‘는 파란색 (‘blue’)의 실선 (‘-‘)을 의미합니다.
plt.plot(x,y4, 'b-')
plt.title('np.exp(x) / pow((1+np.exp(x)), 2)')
plt.axis([-5, 5, 0, 5])# xmin, xmax, ymin, ymax
plt.xlabel('x')
plt.ylabel('y')


fig1 = plt.gcf()
plt.tight_layout()
plt.show()
plt.draw()
#dpi default=100
fig1.savefig('test.png', dpi=200, facecolor='#eeeeee', edgecolor='blue')

반응형
'개발 > Note' 카테고리의 다른 글
| Unwind Segue 사용방법 (0) | 2023.01.11 |
|---|---|
| 랜덤 seed 초기화 (0) | 2022.11.18 |
| git 소스코드 비교 (0) | 2022.02.23 |
| 20진수 변환 (0) | 2021.09.16 |
| root-level 디렉토리에 폴더, symbolic link 생성 방법 (0) | 2021.03.15 |
